
Indicators disaggregated by functional difficulty status
Indicators disaggregated by functional difficulty status
Disaggregated indicators by functional difficulty status results are presented in Results Tables for each country and its regions with a table for each of the three disaggregation methods described in section 4.). In the Results Tables, the difference between two functional difficulty status groups and its statistical significance is noted in a separate column. Statistical significance is based on a t-test (*, **, and *** at the 10%, 5% and 1% levels, respectively). There may be patterns of disadvantage that affect subgroups of persons with disabilities and their households, such as women and rural residents. Results Tables also give a disaggregation by functional difficulty status for subgroups of the population (by sex, rural/urban, age group).
6.1 Is disaggregation by functional difficulty status feasible at the subnational level?
The 15 countries under study were selected given the availability of a dataset that is representative at both national and regional levels and has the WG-SS. For two countries (Guatemala and Tonga), each census dataset under analysis includes the entire population. For Kenya, the dataset is a random 10% sample of the population. For 12 countries, each DHS follows a complex survey design and has a sample of the country’s household-based population.
For Tonga and Guatemala census data, data is available for the entire household-based population: we set at 20 the smallest cell size that is required to present results for population subgroups. For Kenya’s census and DHS data for 12 countries, where data is from nationally representative samples, we set at 50 the minimum number of observations required to produce estimates. Given this constraint, for a given country, disaggregation may be possible for some groups, but not others. For instance, in a primarily agrarian country, there may be more than 50 observations for adults with functional difficulties for the subgroup of rural residents, but not for the subgroup urban residents.
Figure 6.1: The gradient in the gap in less than primary school completion at the regional level (in percentage points)
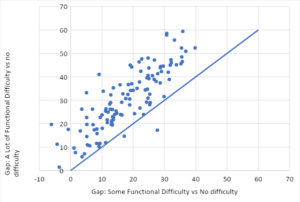
Note: This figure plots the gap in the share of adults with less than primary schooling for each region in 12 countries between persons with some difficulty and persons with no difficulty on the horizontal axis and the gap between persons with at least a lot of difficulty and persons with no difficulty and on the vertical axis
Source: Own calculations using DHS data for 12 countries
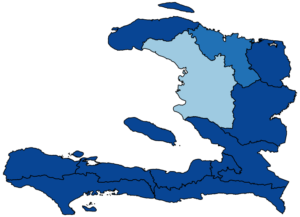
Figure 6.2: Multidimensional poverty headcount among persons with no, some and at least a lot of difficulty in Haiti (%)
6.2.a: No Difficulty

6.2.b: Some Difficulty

6.2.c: At least a lot of Difficulty

Despite this sample size constraint, our results suggest that it is possible to produce indicators disaggregated by functional status at the regional level to document within country inequalities based on functional difficulty status.
Leveraging data collected by the DHS program, we are able to produce all indicators at the regional level within countries except employment indicators. We can also further disaggregate among women, men, residents of rural areas and residents of urban areas. However, sample sizes were too small within each region to disaggregate across four age groups (15 to 29, 30 to 44,45 to 64, 65 and older). Instead, we cover two wide age groups (15 to 44; 45 and older). For employment[8], sample sizes at the regional level were often below 50, in particular for persons with at least a lot of difficulty: employment indicators were thus not produced with DHS data. In the DHS, only a subsample of household adults answer the questions on employment.
With census data in three countries, we could produce the indicators in Table 4.1 disaggregated by functional status and for subgroups based on gender, rural/urban residence and age. Results could also be produced for most indicators and subgroups at the district level. For Guatemala, one map was produced at the village level and is included below (Figure 6.3).
Figure 6.3: Gap in the multidimensional poverty headcount by functional difficulty status in Guatemala at the village level
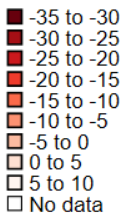
6.3.a Gap in poverty headcount between adults with no difficulty and adults with some difficulty

6.3.b Gap in poverty headcount between adults with no difficulty and adults with at least a lot of difficulty
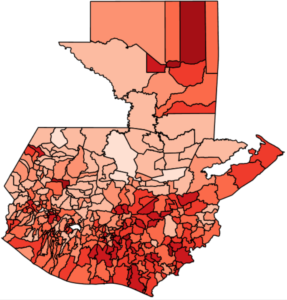
Source: Own calculations based on Guatemala population census (2018)
The ability to disaggregate a wide range of indicators at the regional and district levels with census data highlights the importance of census data to document and investigate within country disability inequalities. Compared to survey data, while census data tend to be collected less often, they go a longer way when it comes to making possible subnational disability disaggregated indicators.
Some of the key results on disability disaggregation are highlighted below for education, personal activities, health, standard of living and multidimensional poverty. Detailed results are available in each country’s Results Tables.
6.2 Disability gaps in education
This section describes and discusses the main results on education. This report uses five indicators on educational outcomes for adults. The first one is the share of the adult population who has ever attended school. In addition, the highest level of educational attainment achieved is captured through three indicators: share of adults with less than primary school completion, the share of adults with primary school completion and the share of adults with secondary school completion or higher. The report also includes results for the literacy rate defined as the share of individuals who can read and write in any language (SDG indicator 4.6.1).
For the share of adults who ever attended school, educational attainment indicators, and literacy rates, results consistently point at adults with functional difficulties being worse off at both national and subnational levels. The educational gap between those with and without functional difficulty is greater for those with at least a lot of difficulty then for those with some difficulty.
The gradient in the disability gap for educational indicators, that is the fact that persons with some difficulties are worse off than persons with no difficulty, but better off than persons with at least a lot of difficulty, is consistently found across countries at both national and subnational levels.
This finding is illustrated in Figure 6.1 for the 119 regions of the 12 countries with DHS data. Figure 6.1 is a scatter diagram of the gap in the share of adults with less than primary schooling between adults with some difficulty and no difficulty on the horizontal axis and between adults with at least a lot of difficulty and no difficulty on the vertical axis. Almost all dots are above the diagonal line, which shows that the gap in the rate of adults with less than primary schooling is consistently higher when comparing adults with at least a lot of difficulty and no difficulty than when comparing adults with some difficulty and no difficulty[9].
The results above confirm what has been found at the national level for many other countries (United Nations 2019; Mitra and Yap 2021, 2022). What is new is how such results are also regularly found at the subnational level. The disability gaps in education indicators found in this report result at least in part from lower school attendance rates among children with disabilities (UNICEF 2021). They may also be due to education being a social determinant of functional difficulties. Having less education may put persons at higher risk of getting a health condition or injury and a resulting functional difficulty perhaps through jobs with risky working conditions or lack of access to health care.
6.3 Personal Activities
A wide range of personal activities are relevant to wellbeing, in particular paid work, unpaid work, commuting, and leisure time (Stiglitz et al. (2009). Personal activity indicators are reported for Guatemala, Kenya, Tonga only as the other 12 countries did not have large enough sample sizes for these indicators to be used to do subnational disability disaggregation. Indicators are described in Box 2.
For the employment population ratio, we find a disability gap at both national and regional levels in Guatemala and Tonga, while a reverse gap is found for Kenya. In Kenya, persons with functional difficulties (both some difficulty and at least a lot of difficulty) are on average more likely to work than persons with no difficulty. Indica
At the same time, workers with functional difficulties are significantly more likely to do informal work than workers with no difficulty in Kenya, Tonga and Guatemala.
For the youth idle rate or NEET, results are mixed. Compared to youth with no difficulty, the youth idle rate of youth with any difficulty is significantly higher in Kenya but lower in Guatemala at both the national and regional levels. In Kenya, there is a gradient with the youth idle rate at both national and regional levels. At the national level, Kenya’s youth idle stands at 10% , 25% and 32% for youth with no difficulty, some difficulty and at least a lot of difficulty. In Tonga, there is a disability gap in the youth idle rate at the national level, with youth with functional difficulties having on average larger idle rates. For Tonga, youth idle rates could not be produced at the subnational level due as the sizes of subnational groups below 20.
We also use indicators on access to ICT. These are the shares of adults who recently used the internet; recently used a computer; and own a mobile phone (SDG indicator 5.b.1.).
There was no consistent pattern across the three countries for the share of workers in the manufacturing sector. In Tonga, workers with functional difficulties are more likely to work in the manufacturing sector at the country level (difference of five p.p.) but this result held in only two of five regions. In Kenya, workers with functional difficulties were less likely to work in manufacturing but the difference was small at one p.p. and was not significant in most regions. Finally, in Guatemala, workers with functional difficulties in most regions and districts were less likely to work in manufacturing and in most cases the difference was larger than 2 p.p.
| Box 2: Personal activity indicators The term “work” is broad and includes both paid and unpaid work. Unpaid work can be for instance, working in a family enterprise while paid work means being employed by another person or organization whether in the formal or informal economy, or through self-employment. This report uses five work indicators for adults. The first one is the employment population ratio, also called the employment rate. It captures the share of the adult population who is employed, i.e. working for pay or those who are self-employed, even if unpaid.The youth idle rate or NEET (youth Not in Education, Employment or Training) measures the share of youth aged 15-24 years who are not enrolled in school and are not employed (SDG indicator 8.6.1). We measure the share of the employed in the manufacturing sector (SDG 9.2.2) and the share of women who hold managerial positions (SDG 5.5.2). Finally, the informal work indicator captures the share of adults who do informal work, i.e., who are self-employed, those who work for a microenterprise of five or few employees or in a firm that is unregistered and those who have no written contract with their employers (ILO 2018). It also includes persons who work unpaid, including for a family business (SDG indicator 8.3.1). |
We also use indicators on access to ICT. These are the shares of adults who recently used the internet; recently used a computer; and own a mobile phone (SDG indicator 5.b.1.).
There was no consistent pattern across the three countries for the share of workers in the manufacturing sector. In Tonga, workers with functional difficulties are more likely to work in the manufacturing sector at the country level (difference of five p.p.) but this result held in only two of five regions. In Kenya, workers with functional difficulties were less likely to work in manufacturing but the difference was small at one p.p. and was not significant in most regions. Finally, in Guatemala, workers with functional difficulties in most regions and districts were less likely to work in manufacturing and in most cases the difference was larger than 2 p.p.
Persons with functional difficulties were less likely to have used a computer recently in Kenya and Guatemala at the national level. This result held in most regions of Kenya and in all regions in Guatemala[10].
Finally, at the national level, there are disability gaps in internet use of five p.p. in Kenya and Tonga and of 10 p.p. in Guatemala. Disability gaps in internet use were found in most regions in Kenya and Tonga and in all regions in Guatemala.
6.4 Are there disability gaps in proxies for health indicators?
This section presents results for two indicators that are proxies for health: the share of adults living in households with safely managed drinking water (CRPD Article 25, SDG indicator 6.1.1) and the share of adults living in households with safely managed sanitation (CRPD Article 25, SDG indicator 6.2.1).
At the national level, for the share of adults with safely managed drinking water and the share with safely managed sanitation, results are mixed. For water, six countries have a disability gap and five countries have similar shares of adults with safely managed water across functional difficulty status. Four countries have a reverse gap, i.e. the share of adults with any functional difficulty with safely managed drinking water is significantly higher than that of adults with no functional difficulty. A similar mix of gaps, reverse gaps and no difference is found for the share of adults with safely managed sanitation across functional difficulty status.
Within countries, there is a lot of heterogeneity across regions in the situation of persons with functional difficulties. For instance, in Mauritania, the share of adults with any difficulty with access to safely managed drinking water is at 77% in Nouakchott Ouest but at 36% in the Hodh Echargui region. In the five countries without a significant disability gap at the national level for the share of adults with safely managed drinking water (Cambodia, Mali, Maldives, Senegal, South Africa), there is a disability gap in some regions. In reverse, in the seven countries with a disability gap at the national level (Haiti, Kenya, Rwanda, Timor Leste, Tonga, Uganda, South Africa), there are regions with no disability gap. For instance, in Kenya, out of 47 regions, 28 have a disability gap, nine regions have a reverse gap and 10 show no difference.
Overall, results on disability gaps in terms of access to safe water or sanitation do vary across and within countries. Within countries, national estimates can hide heterogeneity at the regional level. The indicators used in this study have important limitations. They capture safely managed water and sanitation at the household level and do not guarantee that water and sanitation services are accessible to persons with disabilities within the household.
6.5 Are there disability gaps in standard of living indicators?
Indicators related to the standard of living of adults’ households inform CRPD Article 28 on “Adequate standard of living and social protection” and include the share of adults in households with electricity (SDG 7.1.1); using clean fuel for cooking (SDG 7.1.2); with adequate housing; who own assets; and who own a cell phone (SDG 5.b.1).
Overall, results are mixed and similar to those on water and sanitation above. At the national level, disability gaps in standard of living indicators are found for some countries. When gaps are found, they tend to be small (under five percentage points) and larger for adults with at least lot of difficulty than for adults with some difficulty. Within countries, there is a lot of heterogeneity across regions with respect to the situation of persons with functional difficulties and the disability gap. Among the standard of living indicators, disability gaps tend to be the most consistent across countries and regions for the share of adults in households who own a cell phone.
6.6 Is there a disability gap in multidimensional poverty?
Poverty can be measured by counting the number of deprivations experienced by an individual or households and by identifying those with multiple deprivations. At both national and regional levels, we estimate a multidimensional poverty headcount of adults based on functional difficulty status (Alkire and Foster 2011, Method Brief 3). The results are available in each country’s Results Tables. We identify adults as being multidimensionally poor when they are deprived in more than one dimension of wellbeing. Dimensions include education, health, personal activities (employment) and standard of living.[11] The employment dimension is used only for the three countries with census data as with DHS data, cell sizes at the regional level were sometimes below 50 for persons with functional difficulties.
In the 15 countries under study, the multidimensional poverty headcount among persons with functional difficulties is consistently high (above 50%) at the national and regional levels. We find a gradient in the association between multidimensional poverty and functional difficulties at the national level in all countries. In other words, persons with some difficulty have higher poverty headcounts than persons with no difficulty, but lower ones than persons with at least a lot of difficulty.
Across countries, adults with all types of functional difficulties have significantly higher headcounts than adults with no difficulty. In most countries, adults with self-care and communication difficulty have higher multidimensional poverty headcounts while adults with seeing difficulties have lower headcounts compared to adults with other types of difficulties. Across and within all countries, adults with functional difficulties in rural areas and in older age groups have higher headcounts on average than their counterparts in urban and younger age groups respectively. In most countries, women with functional difficulties are worse off than men with functional difficulties in terms of multidimensional poverty.
The gradient in multidimensional poverty was also found within countries at regional and district levels. For example, Figure 6.2 shows maps for Haiti representing the multidimensional poverty headcount by functional difficulty status. In most regions, the shares of adults who are multidimensionally poor are in the 60-69, 80-89 and 90-100 ranges respectively for persons with no difficulty, some difficulty and at least a lot of difficulty.
While persons with functional difficulties are disproportionately poor, how poorer they are on average compared to persons with no difficulties may vary across regions. For example, in Mali, in some regions with very high multidimensional poverty headcounts, there is little to no difference between persons with and without functional difficulties. More broadly, we find that the higher the multidimensional poverty headcount at the regional or national level, the less the gap between persons with and without functional difficulties.
The subnational variation in the disability gap in multidimensional poverty is illustrated for Guatemala at the village level in Figure 6.3. The maps to the left and the right respectively present at the village level the gap in the multidimensional poverty headcount between persons with no difficulty and some difficulty, and between persons with no difficulty and at least a lot of difficulty. The disability gap in multidimensional poverty tends to be larger in villages in the South compared to those in the North. Some villages have reverse gaps, meaning that persons with difficulties have lower headcounts than persons with no difficulty in some villages. These villages have very high multidimensional poverty rates (above 80%).
Overall, at national and subnational levels, persons with functional difficulties, on average, often experience multidimensional poverty. This result adds to a large and growing literature on the association between disability and multidimensional poverty (United Nations 2019) this time documenting it at the regional level.
Implications for policy
Multidimensional poverty headcounts are significantly higher for persons with functional difficulties compared to persons with no difficulty at national and subnational levels. This result highlights the importance for development projects, no matter where they are within a country, to be inclusive of persons with disabilities. Persons with disabilities should be explicitly incorporated in policymaking and research agendas related to education, health, work and the standard of living at both national and subnational levels.
Implications for further research
We found some within-country variations in the multidimensional poverty status of persons with disabilities. This result begs for more research on the drivers of this heterogeneity within countries. The barriers persons with disabilities face and the resources they have vary across geographies and may contribute to diverse inequality outcomes within countries.
[8] A similar result was reached for family planning and interpersonal violence. In the DHS, a subsample of women answers questions on family planning and domestic violence.
[9] In four out of 119 regions, the gap between some and no difficulty is negative, reflecting that adults with some difficulty on average have a higher rate of primary school completion compared to adults with no difficulty.
[10] There was no information on computer use in Tonga’s 2016 census.
[11] Details on the indicators and thresholds are described in Method brief 3.